
Principles, Scenarios and Suitability
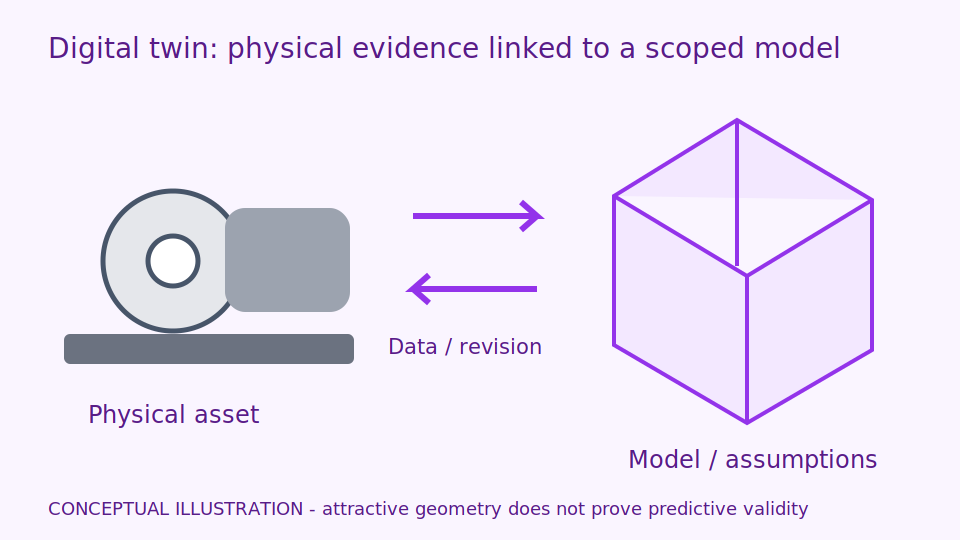
A digital twin is a model linked to asset data for a defined purpose, not merely a three-dimensional image. State whether it represents geometry, status or dynamics, and identify outputs that remain outside the calibrated operating scope.
Think of a map carrying real-site information, but identifying what is observed and what is calculated. Geometry describes size and position; dynamics describe change over time. A model for finding equipment need not calculate flow. Defining the question first avoids investing in realistic imagery that cannot answer the actual task.
Parameters define model behaviour, such as a tank's cross-sectional area. Residuals are differences between predicted and measured values. Separate model errors from sensor errors. Complexity can improve fit to old data while increasing maintenance and fitting noise. Choose the simplest model answering the question and have engineers review assumptions before widening its scope.
Scroll the diagram horizontally to inspect all details.
Illustrative Design Scenario
Illustrative design scenario: a tank model receives level and flow to estimate time to a limit. When level data is missing, show an estimate range and uncertainty rather than smooth animation that implies measurements are still arriving.
For illustration, a constant-area tank of 10 square metres receives 2 cubic metres per minute and discharges 1. Its level rises by 0.1 metre per minute. With 0.5 metre remaining to a reference limit, the estimate is five minutes. This assumes constant flows and no other connections; it is no guaranteed time for a real tank.
When a pump changes mode, stop displaying the old estimate or recalculate from confirmed information. Animation must not conceal stale inputs. Controllers should check the result against instruments and operating context. Prediction supports planning; it is not a switching command or a replacement for overflow protection.
Inputs and Prerequisites
Use an asset hierarchy, device identifiers, physical parameters, units, coordinate systems and quality-checked time series. Record the model version and the operating range supported by validation data.
An asset hierarchy organises sites, production units and equipment, helping prevent a sensor being linked to the wrong tank. Retain dimensional sources and confirmation dates. Do not infer tank geometry from an external photograph alone, especially where internal shape is unknown.
Separate measured values, calculated values and uncertainty ranges, identifying the parameter version. If inputs are insufficient, explain why an estimate cannot be made. That helps users seek evidence instead of trusting a single number unsupported by the current observations.
Trial and Integration Workflow
- 1Define the question the twin must answer and its physical assumptions.
- 2Map sensors to assets and distinguish measured values from estimates.
- 3Calibrate on one period, then validate against held-out operating periods.
Evaluation and Acceptance Criteria
Measure residuals by operating mode and forecast horizon. Check whether uncertainty intervals cover actual observations appropriately. Acceptance must assess the end question, such as time to a level limit, rather than judging only the realism of a three-dimensional display.
Hold out operating periods not used for parameter fitting. Examine errors after flow changes and delayed data. Report short- and long-horizon predictions separately because uncertainty accumulates differently. A good short forecast does not automatically validate a longer one.
Reviewers should reproduce results from identical data and versions. Check that recovery does not remove estimate labels while values are still calculated. Record situations where the model is inapplicable as explicit boundaries rather than excluding them to improve an overall score.
Scroll the diagram horizontally to inspect all details.
Failure Cases and Limitations
A model suitable for steady operation may fail during startup or emergencies. Fitting parameters to historical data does not guarantee future results. Instrument or equipment changes require mapping review and recalibration rather than simply continuing with the previous model.
Two sensors with errors in the same direction can make the model appear consistent while both differ from reality. Use reference checks and instrument histories. Agreement between sources is not always independent proof, particularly when they share a common measurement or conversion error.
Simulation supports study without disrupting a plant, but responsible personnel must review results before changing real work. This guide claims no installed twin, process-control capability or safety certification for physical trials. Model output remains bounded by its verified assumptions.
Practical Checklist
- Are the twin purpose and boundaries explicit?
- Are estimates labelled differently from measurements?
- Can parameters and model versions be reproduced?