Skip to content
TH
📊 Analytics

Analytics & Reports

Turn AI data into actionable insights — Dashboard, Trend Analysis, Custom Reports

Analytics & Reports

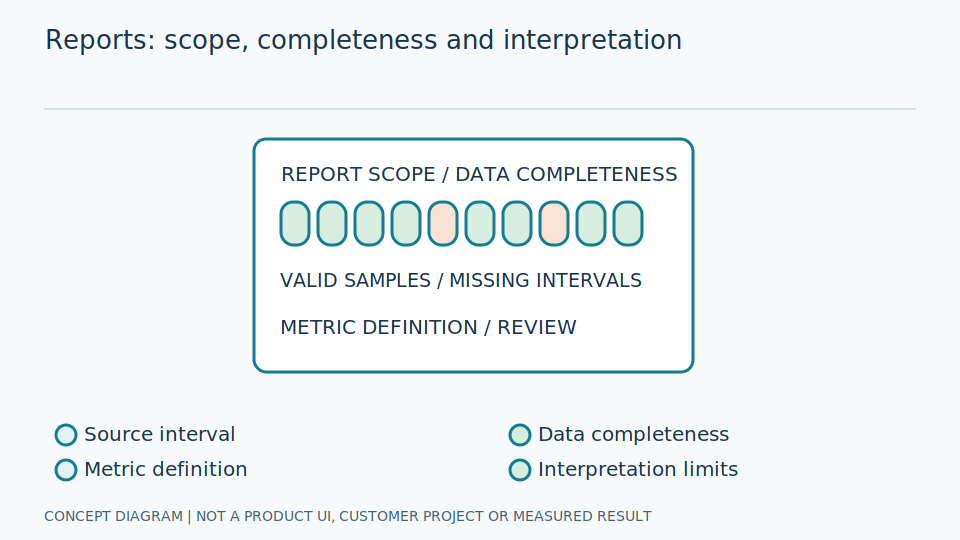
Conceptual illustration, not a product screenshot or measured result.

Real-time
Dashboard
50+
Templates
Auto
Scheduled
📊 Analytics

What's Included

📊

Real-time Dashboard

Live dashboard with real-time data updates

📈

Trend Analysis

Time-based trend analysis and forecasting

📋

Custom Reports

Build reports tailored to your needs

🔔

Alert Rules

Automatic threshold-based notifications

📧

Scheduled Reports

Automated report delivery on schedule

📱

Mobile Friendly

View reports on any mobile device

📋

Our Process

1

Define KPIs

Collaborate to identify key performance indicators

2

Dashboard Design

Design layout and visualization elements

3

Alert Configuration

Set thresholds and notification channels

4

Delivery & Training

Handover with usage training

✅

Key Benefits

Faster Decisions

Real-time data enables timely decision-making

Spot Trends

See problems before they occur

Automated Reports

No more manual report creation

Access Anywhere

Executives can view from any location

Meaningful reports start with consistent data

Continuous graphs show trends, but gaps and invalid states matter too. Preserve time, unit, point identity and quality. Filling gaps with zero or the previous value without explanation can create a nonexistent trend.

Define the report audience: operators review recent events, engineers examine point quality and managers assess workloads or completeness. Metrics differ by responsibility; one dashboard does not replace every need.

Check units and quantity meanings before combining instruments. Averaging different ranges, cumulative totals and instantaneous values without distinction creates numerical but uninterpretable reporting.

Scroll the diagram horizontally to inspect all details.
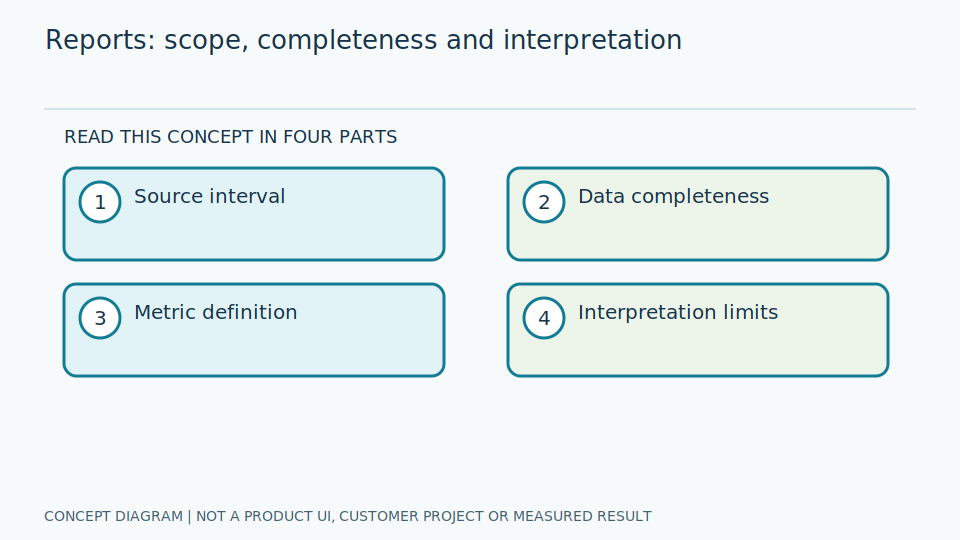
Meaningful reports start with consistent data
Meaningful reports start with consistent dataConceptual illustration, not a product screenshot or measured result.

Interpret trends without exceeding the evidence

An anomaly invites investigation, not automatic fault diagnosis or remaining-life prediction. Consider load, operating conditions and maintenance history. Without failure evidence, describe monitoring or screening rather than guaranteed forecasting.

Separate wrong readings, unreadable observations and delivery delays with counts by condition. Overall scores can conceal night or reflection problems, while frame counts can count one event repeatedly.

Reports, exports, alerts and further analysis require confirmation with an SI partner. These explanations help define questions and trials; they do not establish existing features or guaranteed commercial conclusions.

common.cta.title

Explore AI Technology and Practical Guides

Read published articles on principles, limitations and system evaluation.

News