Skip to content
TH
Principles and evaluation

From gauge images to traceable data

Understand the pipeline, unreadable conditions and evidence needed before operational use.

From gauge images to traceable data

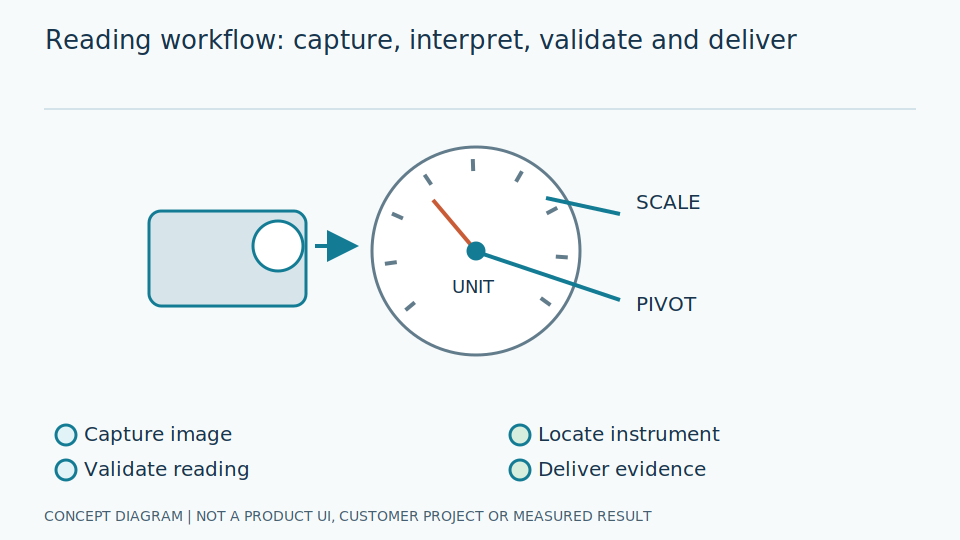
Conceptual illustration, not a product screenshot or measured result.

Overview

Finding a gauge is not the same as reading it correctly

An image-reading system must manage camera quality, scale mapping, units, timing and validation. This is a reference architecture, not a promise that every device or protocol is supported. Confirm the actual scope through site assessment and a pilot.

Scroll the diagram horizontally to inspect all details.

A <span class="text-gradient-primary">four-stage pipeline</span>
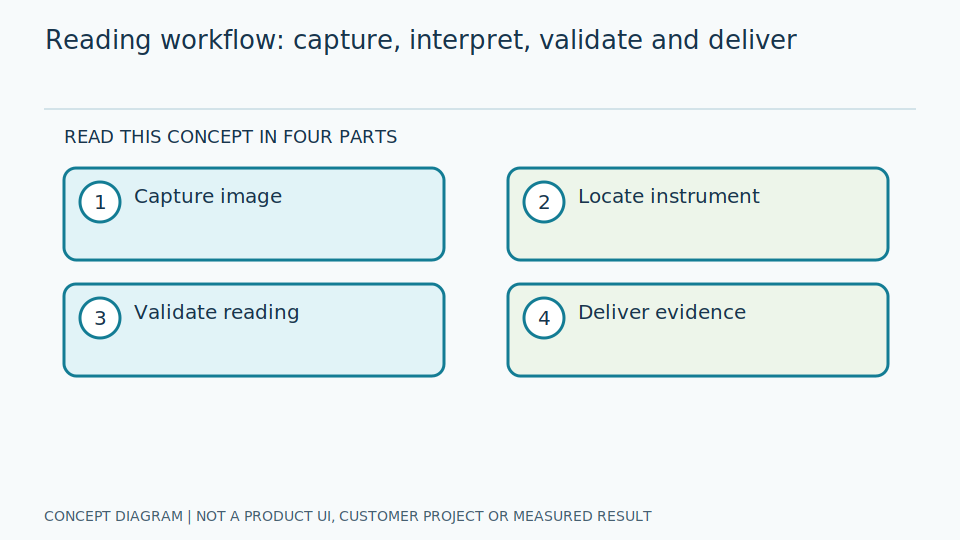
A <span class="text-gradient-primary">four-stage pipeline</span>Conceptual illustration, not a product screenshot or measured result.
Pipeline

A four-stage pipeline

Each stage needs defined inputs, acceptance conditions and failure handling.

01

Capture and check image quality

Choose camera position, optics, lighting, focus and reading region. Check blur, reflections, occlusion and camera movement before interpreting the image.

Image Capture
  • Record capture time and camera identity
  • Test across shifts and scale ranges
  • Define blur and visibility limits
  • Enhancement cannot recover invisible evidence
02

Locate and interpret the gauge

Locate the instrument and correct perspective where appropriate. Map needle geometry to the scale, or read digits while checking decimal points, signs and units.

Object Detection
  • Separate detection from measurement
  • Validate zero, scale range and units
  • Use appropriate mapping for nonlinear scales
  • Version the model and configuration
03

Validate or reject the observation

Consider image quality, model score, permitted range and temporal consistency. A high score is not a guarantee of correctness. Return invalid when evidence is insufficient.

Value Reading
  • Distinguish valid, invalid and stale
  • Never use zero as an error placeholder
  • Separate reading errors from process anomalies
  • Define risk-based human review
04

Deliver data and retain evidence

Deliver values with units, capture timestamps, quality and versions to the agreed destination. Design queues, retries and deduplication for connectivity failures.

Reporting
  • Separate capture and receive timestamps
  • Never present old values as current
  • Test tag mappings and data types
  • Apply access and retention rules to images
Components

Technologies working together

Choose based on instrument characteristics, data and system constraints.

01

Optics and lighting

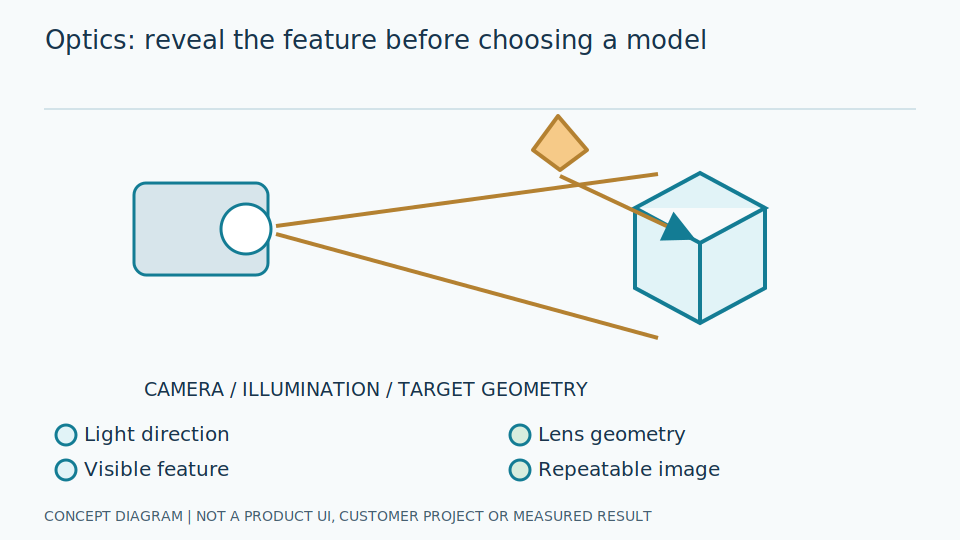
Make the required detail visible before choosing a model. Resolution alone does not solve reflections.

02

Object detection

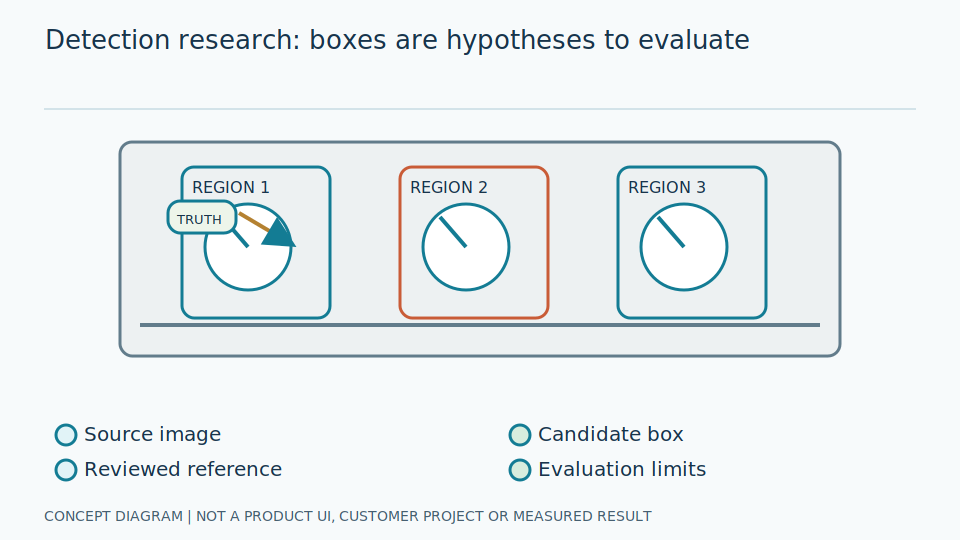
Locate instruments; measure recall and false positives separately from reading error.

03

Geometry and OCR

Interpret needles or digital text, validating instrument-specific scales, units and decimals.

04

Edge or cloud

Evaluate latency, connectivity, image policy and maintenance on target hardware.

05

Data integration

Define schema, quality, timestamps and deduplication before database or SCADA integration.

06

Operations

Monitor data quality and visual changes, back up configuration and plan model rollback.

Evaluation

Measure with site evidence

Agree on tolerances and test data before a pilot; no single number describes the whole system.

Numerical reading error

Compare with a documented reference. Report native-unit and full-scale error where appropriate.

Error

Unreadable observations

Report invalid readings out of all observations, causes and review effort; disclose exclusions.

Invalid rate

End-to-end speed

Measure capture-to-delivery latency, separating queueing, inference and networking with hardware and load stated.

p95 / p99

Data continuity

Check gaps, recovery after connectivity loss and when observations become stale.

Freshness

Operational impact

Compare before and after, including review and maintenance. Saved time is not automatically cash savings.

Pilot

Follow one reading from dial to user

Reading begins with an image showing the scale and needle clearly. Locate the correct instrument, then identify geometric points such as center and needle tip before converting the angle using its range and unit. Correct detection does not establish correctness of every later stage.

Confirm the actual scale, including direction, sweep and nonlinear ranges. An incorrect configuration may produce smoothly changing but wrong numbers. Digital displays require decimal points, minus signs and units, not partial text recognition.

Associate the result with instrument identity, capture time and validity before presentation or storage. Stage timestamps distinguish processing delay from delivery delay. Quality states prevent old or unclear observations appearing as successful fresh readings.

Why unreadable is a necessary result

Zero can be genuine when a process stops or pressure falls. Do not use it to represent unreadable images. Reflections, fogging, occlusion and missing dials need distinct states and reasons so maintainers can correct imaging or use a backup inspection method.

Model confidence is an internal signal, not evidence of numerical correctness at that percentage. Validate rejection thresholds using real examples and report both answered errors and rejection rates. Forcing every image to yield a value can conceal dangerous guesses.

Acceptance should compare with people or reference instruments under agreed definitions. Separate image-reading error from instrument uncertainty. A camera does not calibrate a gauge or replace independent protective signals for emergency or safety functions.

Keep readings meaningful during trials and maintenance

Begin in shadow mode alongside the existing method without control write-back. Cover shifts, scale ranges and lighting. This establishes appropriate scope before workflow integration; a few demonstration images cannot validate an actual site.

Recheck geometry and scale conversion after camera, lens, lighting or software changes. Version settings with results and assign ownership of missing data, blur and deteriorating quality.

Review each additional reading point, even when sharing a model: scales and acceptance thresholds may differ. Actual integration, device support and service terms require confirmation with an SI partner rather than inference from the pipeline diagram.

Start with a defined reading point

Prepare instrument types, ranges, point counts, example images and destination systems to discuss pilot scope and acceptance criteria.

Explore AI Technology and Practical Guides

Read published articles on principles, limitations and system evaluation.

News