
Content Level: Overview / Implementation considerations
Principles and Suitability
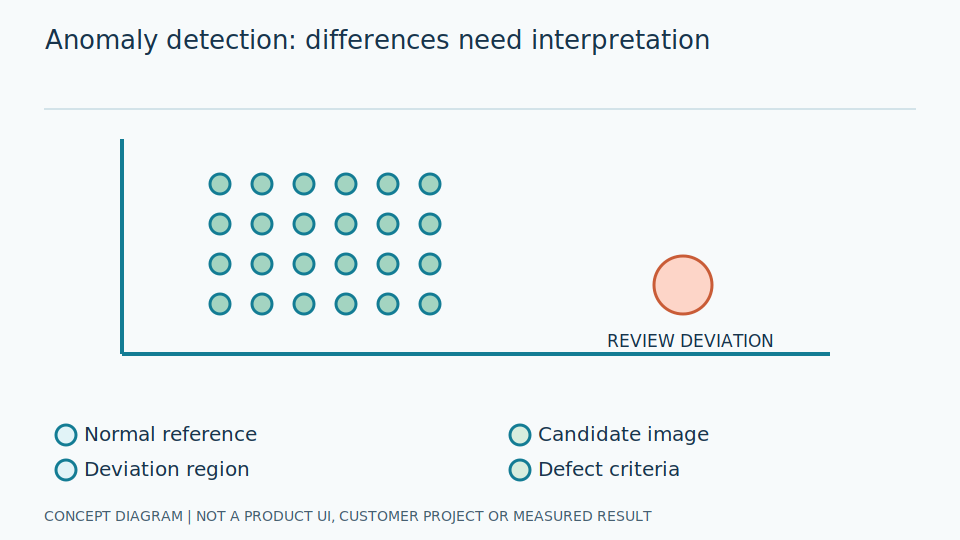
Anomaly detection measures departure from normal patterns using numeric statistics or image features. Novelty detection learns from curated normal data, whereas outlier detection may work with a training set that already contains abnormal examples.
Here, abnormal means different from the baseline, not necessarily dangerous or defective. A new dial colour may differ greatly while remaining readable; a small shadow over a decimal point may differ little but alter the answer. Define the target condition and response to alerts, rather than turning a difference score into an unsupported judgement about equipment health.
Specify the normal baseline's scope and whether scoring uses complete images or selected regions. Reconstruction methods compare originals with images rebuilt from learned representations; feature-distance methods compare representations against learned normal groups. Both need thresholds chosen from relevant validation data. Scores from different methods are not measurements in a common physical unit and should not be interpreted interchangeably.
Scroll the diagram horizontally to inspect all details.
Illustrative Industrial Example
Illustrative design scenario: check for fogging or unusual illumination on a dial before passing the image to a reader. Keep this separate from a high-pressure alarm, which concerns a process value rather than an abnormal image.
Suppose cleaning glass reduces glare and changes the image. The detector may flag a difference despite improved readability. Review originals and high-scoring regions to decide whether this is acceptable change or a fault. Do not immediately add every image to normal training data: unreadable cases may broaden the baseline beyond the task's acceptable conditions.
Separate image-condition alerts from process-value alarms. Check whether scores follow fog over scale marks or merely a changed background. If local anomaly regions guide decisions, return score maps mapped correctly onto originals, with a pending-review status. Do not convert anomaly scores into defect codes or machine-risk categories without a separate confirmation process defining and validating those meanings.
Study and Trial Workflow
- 1 Collect normal conditions covering shifts, lighting and material types.
- 2 Keep separate validation examples of abnormal events confirmed by human reviewers.
- 3 Define a threshold and review route instead of declaring every high-scoring image a defect.
Evaluation and Metric Definitions
Measure precision-recall and false alarms over real operating intervals. Add mask evaluation when localization is required. Distinguish anomalies affecting readability from harmless changes in the background scene.
False-alarm workload depends on events, not merely frames: one condition may persist across many images. Define event grouping and observation duration before counting, and explain human confirmation criteria. Separate high-scoring but readable images from conditions making measurements unusable. That distinction explains practical value rather than treating every departure from the baseline as an equally consequential incident.
Test varied normal conditions and defined abnormalities without using test images to choose thresholds. Inspect score distributions by camera and lighting, including missing image regions. If a lighting change raises scores across the image, inspect preprocessing before concluding that multiple defects appeared. Measure localisation quality separately from the ability to identify that an abnormal event exists; success at one does not establish success at the other.
Limitations and Failure Cases
Novelty does not automatically mean a defective product, and defects resembling normal data may pass. Reconstruction models may reproduce defective images well enough to assign low anomaly scores.
Contaminated normal data can teach the system to regard faults as ordinary. Conversely, a narrow baseline can flag minor changes continually. Curating data and documenting scope matter more than expecting detection of every unseen fault. Distinguish tested abnormality types from unknown ones; novelty detection is not proof of universal coverage for defects never represented in evaluation.
A threshold reducing notifications lowers review effort but may admit problematic images. Review historical outcomes using verified answers and retain baseline versions. Image alerts prompt investigation, not attempts to make machinery malfunction. Use appropriately collected images or simulations to test methods, leaving operational decisions within a process with clear responsibility. An anomaly score alone does not identify either cause or the safest response.
Practical Checklist
- Has the normal dataset been checked for contamination?
- Is the anomaly definition usable by human reviewers?
- Is threshold behaviour monitored when lighting changes?