
Principles and Suitable Contexts
Start with descriptive statistics and explainable rules before considering complex models. Analysis is useful when the data covers the operating conditions relevant to the question. Correlation does not establish causation, and a statistical anomaly does not necessarily mean that equipment is about to fail.
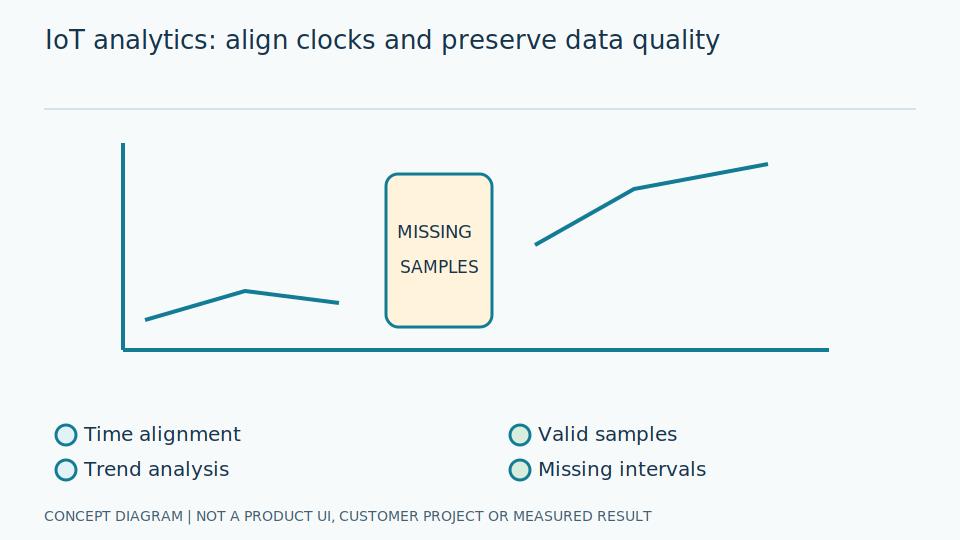
Descriptive statistics expose ranges, central values and changes over time before asking why they changed. Missing data means absent measurement evidence, not zero. Forecasting estimates unseen future values; anomaly detection finds departures from a defined pattern. These require different questions and responses. Do not name every unusual observation a failure, particularly when normal operating modes can produce substantially different patterns.
Features must genuinely exist at decision time. Post-event information or maintenance records entered later can make historical results look good without being usable in operation. Time-based test splits help reveal this leakage. Separate machine modes because normal patterns can differ; one overall average cannot represent every condition. A complex model still needs a clearly defined question and an evidence-based interpretation of its output.
Scroll the diagram horizontally to inspect all details.
Design and Data Preparation
Align units, timestamps, quality records and maintenance history. Distinguish missing values from zero. Split data by time and device before constructing features, so future information cannot leak into training. Retain a simple baseline rule for comparison rather than evaluating a more complex approach in isolation.
Define independently verifiable events, their start and end times and reference-label owners. Never use the model's own alerts as ground truth. Align units and averaging periods before combining sources, retaining sensor or configuration changes to distinguish measurement-system change from process change. Reference events should explain what was confirmed and how, rather than borrowing certainty from a prior automated classification.
Divide training, tuning and test periods before filling gaps or estimating typical values, using only rules learned from earlier information. Specify which gaps may be filled and which must remain absent. Build an explainable baseline, such as checking user-defined bounds, and record every method change. Another reviewer should be able to reproduce the result from the same dataset without access to undocumented adjustments.
Failure Cases and Limitations
Predominantly normal data can produce impressive accuracy even when every important event is missed. Filling gaps across shutdowns can create artificial trends, and sensor replacement can look like a process change. Retain quality flags and maintenance events so that these effects remain visible during interpretation.
Accuracy is the proportion of all answers that are correct. If important events are rare, always answering normal can produce a high score with little practical value. Examine missed real events and unnecessary alerts separately. Unreadable image values and stale measurements need explicit status so the model does not learn that intervals in which the system cannot observe are normal operation.
Repeated tuning against the test set removes its independence; reserve new data before claiming validation. Association with door opening or job cycles can involve shared factors and does not prove a fault's cause. Analysis should offer observations for responsible inspection, not command live experiments to prove them. General analytical models must not replace safety instrumented systems, interlocks or emergency shutdown circuits.
Trial and Evaluation Methods
For forecasting, use walk-forward testing and report MAE by operating period. For event alerts, measure event-level precision and recall, false alerts per time interval and lead time before an event. Compare against the baseline rules on the same held-out test data to make the comparison meaningful.
Precision describes the fraction of alerts that are confirmed events; recall describes the fraction of confirmed events detected. Define how multiple messages form one event before counting, otherwise repeated alerts distort scores. For forecasting, mean absolute error averages difference magnitudes. State units, operating periods and missing-data results, allowing users to understand whether errors matter to the intended decision rather than judging an isolated metric.
Acceptance should include independent review of event labels and temporal splits, comparing baseline and model on identical data. Report unexplained events and unrepresented conditions rather than turning retrospective results into guaranteed future failure prediction. Statistical and AI-risk frameworks organise tests and limitations; they do not certify a product or justify replacing protective functions with model output. Applicability remains tied to the tested operating conditions.
Review Checklist
- Define the event to detect.
- Split by time before preparing data.
- Report results by machine operating mode.
- Reassess after sensor or operating-pattern changes.
References and Further Reading
References explain technology principles or requirements. They do not establish product certification or support for every requirement.