
Content Level: Overview / Implementation considerations
Principles and Suitability
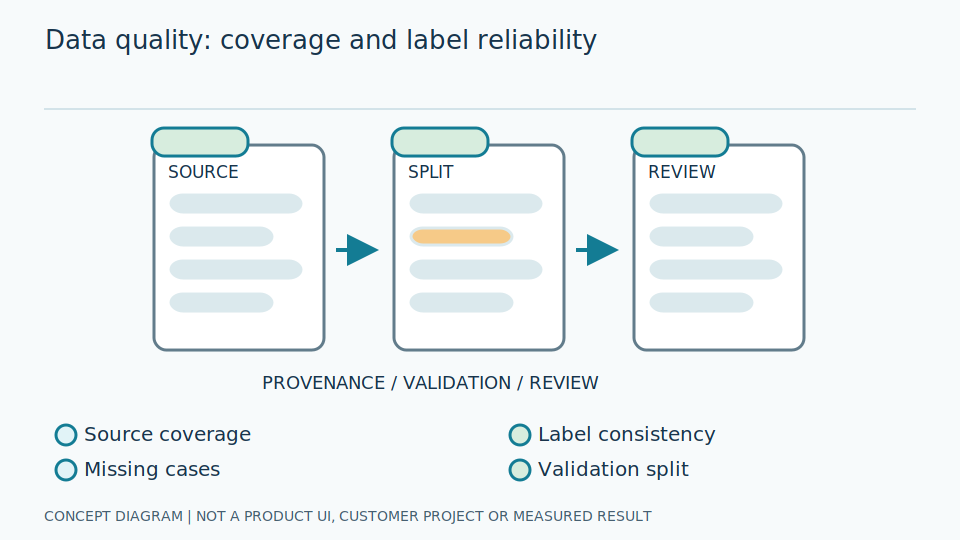
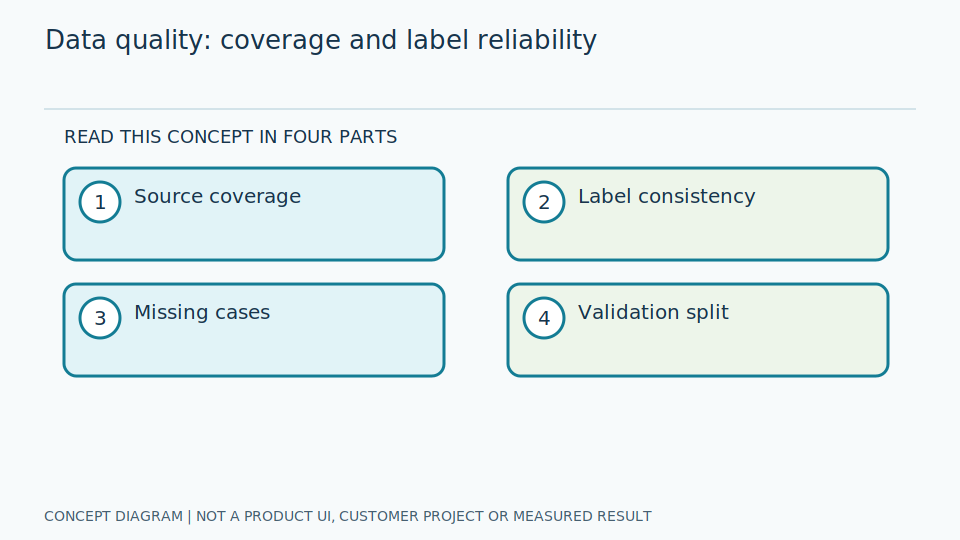
Data quality covers completeness, correctness, consistency, timeliness, and representativeness. A collection of sharp images can still fail to cover operating conditions. Label quality and the quality of the reference source need separate checks: neither a clear photograph nor a complete annotation proves that the expected answer is trustworthy.
Good data fits the question being asked, rather than merely opening successfully as a file. An image may be sharp but lack its unit; an answer may be complete but refer to a different time. Representativeness means including important conditions the system will encounter, such as different angles and lighting. Collecting many more copies of familiar scenes does not fill those gaps, so identify missing conditions before planning collection or correction.
Engineers separate image quality, answer quality, and accompanying metadata, using repeatable criteria for each. A slice is a group defined by conditions, such as one camera under one lighting regime. Examine both sample counts and errors within slices so aggregate rates cannot hide small groups. Quality criteria must reflect what the task actually needs to read, not a single sharpness score applied indiscriminately to every image.
Scroll the diagram horizontally to inspect all details.
Illustrative Industrial Example
Design example: a gauge-image dashboard groups unreadable images by camera, lighting period, unit, and dial model. This points toward missing data rather than simply collecting additional duplicates from the same camera. The grouped summary is a proposed aid for investigation, not evidence that any product already supplies such a dashboard.
Suppose errors concentrate in nighttime images from one camera, but that group has few samples. Adding daytime images from other cameras may not help. First determine whether the issue is lighting, blur, angle, or incomplete answers. A dashboard summarizes information to direct inspection; it does not automatically establish the cause. Reviewers should be able to reopen images and collection history to base decisions on evidence.
Engineers check duplicates using both identifiers and image content, then inspect the units and times attached to answers. If one image has conflicting answers, distinguish a version correction from a genuine error instead of choosing whichever answer the model prefers. Correct verifiable issues and retest on the same independent set, recording reasons so changes reflect improved data rather than removal of difficult images.
Study and Trial Workflow
- 1 List quality dimensions and repeatable inspection criteria for each data source.
- 2 Check damaged and duplicate images, conflicting labels, timestamps, and units.
- 3 Rank error slices, then collect or correct targeted data before retraining.
Evaluation and Metric Definitions
Report data rejection rates alongside task errors for each slice. Compare results before and after correction on the same holdout, without moving difficult images out to improve scores. This separates changes in the data inspection process from changes in the reader and keeps the comparison relevant to the original task population.
A holdout is data reserved from development to check performance on new examples. Report counts before quality inspection, counts passing, and counts readable, with exclusion reasons. If errors fall because more images are rejected, users also need to see the additional review burden. Include nonpassing groups within the declared scope, rather than letting new quality criteria redefine the test population and imply general model improvement.
Engineers compare development-data characteristics with operating data and have reviewers familiar with the criteria inspect answers in error groups. Reference uncertainty must be reported separately from reader error. Verify that corrections do not harm other groups, and do not repeatedly use test images to choose corrections until results match expectations. Continuous monitoring can reveal change, but an accountable person still needs to confirm its interpretation.
Limitations and Failure Cases
No single quality score represents suitability for every task. Artificially balanced data can misrepresent operational false alarms. A quality process therefore needs both task-specific checks and an explanation of how the inspected population relates to actual use; a clean-looking collection alone is not evidence that its error rates will transfer.
Equalizing group sizes can help during some training stages, but evaluation must also explain frequencies within the actual operating scope. Rare abnormal cases can make false alarms a significant share of the workload even when balanced-set results look good. Separate data organization for learning from organization for evaluation, and do not describe results under invented frequencies as real workload without supporting operational data.
Correction adds review costs and risks deleting important rare conditions. Retain unattractive images with an appropriate status when they represent required operating conditions, rather than removing them just to make the collection look clean. Assign data owners and preserve change history for review. These quality guidelines describe a process, not a guarantee of exhaustive coverage or a claim that a product already provides automatic checking and summary mechanisms.
Practical Checklist
- Is an owner identified for every data source?
- Are missing values distinguished from a reading of zero?
- Are data groups with only a few examples tracked?