Skip to content
TH
AI Gauge Reading · Industrial Data

Turn existing gauge images
into traceable data

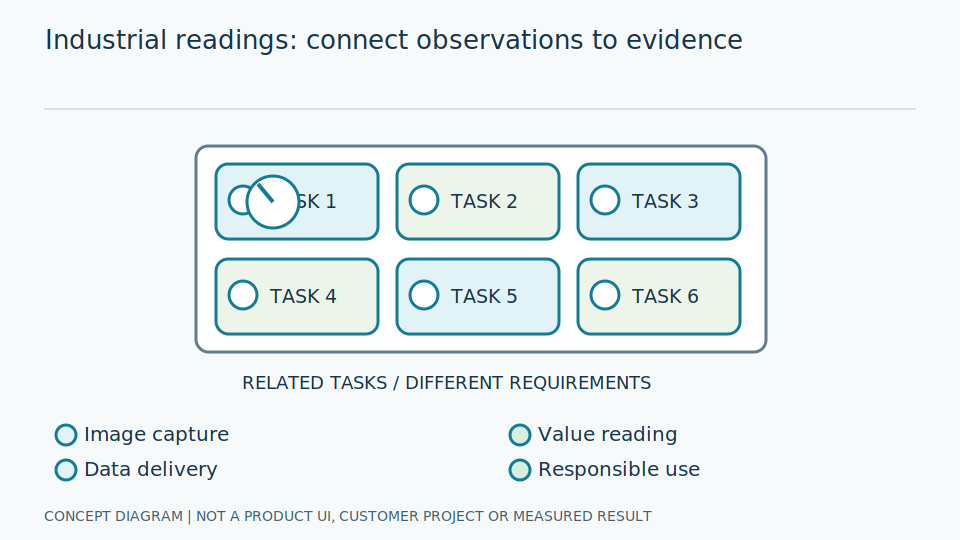
Custom solutions through SI partners for pointers, seven-segment displays, OCR, float levels and lamp/switch states. Assess images, tolerances and destination systems for each project.

Turn existing gauge imagesinto traceable data

Conceptual illustration, not a product screenshot or measured result.

01
Assess images and scales
02
Validate reading quality
03
Integrate an agreed scope

Existing instruments can remain useful while their data stays on a dial. Image reading is an option to evaluate alongside adding sensors or connecting existing signals.

Start with observable evidence, not guaranteed percentages

GaugeSnap focuses on interpreting gauges, meters and visual states for data monitoring. Confirm scale, units, camera position, lighting and unreadable conditions at each point before defining the system scope.

Data integration design

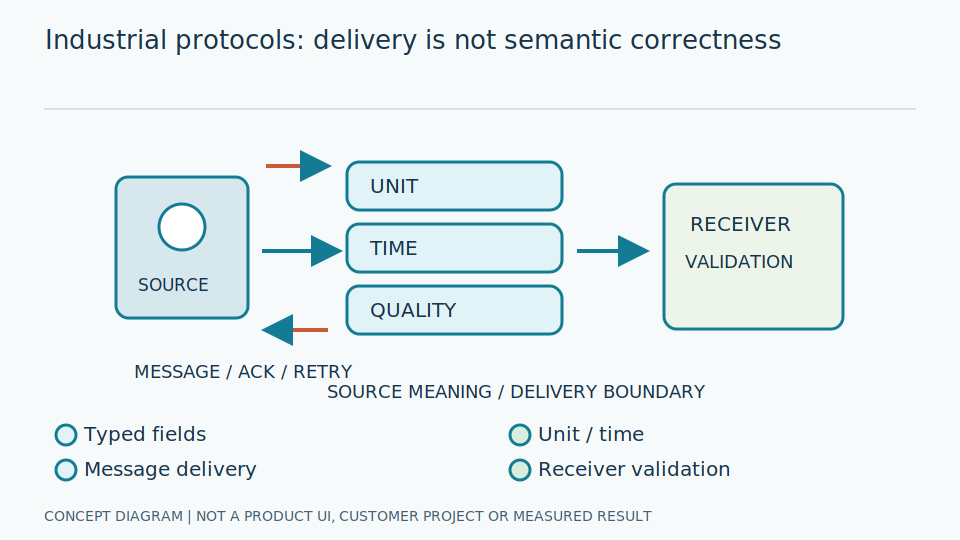
Every reading needs units, time and quality

Potential destinations for joint assessment and testing, not a promise that every connector or version is immediately supported.

01

SCADA / Historian

Agree on tags, quality and timestamps; begin with read-only integration.

02

IoT / Database

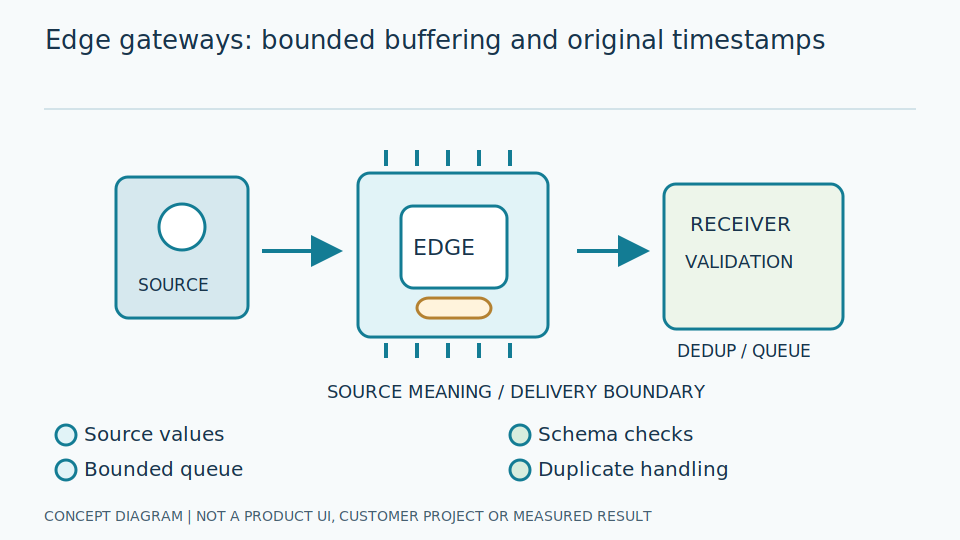
Define schemas, topics or APIs, offline queues, retries and deduplication.

03

Dashboard / Review

Distinguish current, stale and invalid observations, with evidence for review.

⚡

Monitoring is not a safety circuit: ordinary image reading does not replace SIS, interlocks or emergency shutdown. Control write-back needs separate risk-based engineering and authorization.

Objectives to validate

Measure value in a site pilot

01

Reduce transcription

Compare before and after, including review, retries and maintenance.

02

Improve traceability

Define timestamps, configuration versions and evidence for each observation.

03

Find limitations early

Test lighting, reflections, occlusion and cases requiring a human reading.

04

Scale with criteria

Validate pilot acceptance and maintenance before adding cameras or sites.

Data display concept

See values with quality and evidence

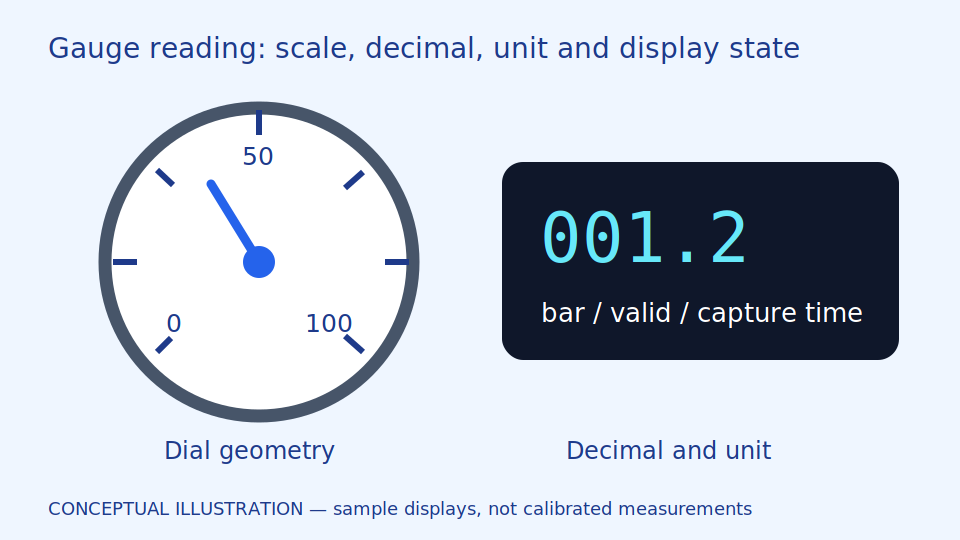
Illustrative data only, not connected to a live camera or factory system.

Illustrative example · not live data
12.4
Example value (bar)
valid
Example quality state
UTC
Capture time to record
v1
Example schema version
Area for trends and missing-data intervals
Area for reference images and unreadable reasons
Example constraints

Different industries need different assessments

Images and scenarios illustrate concepts, not completed customer projects.

Petrochemical and hazardous areas

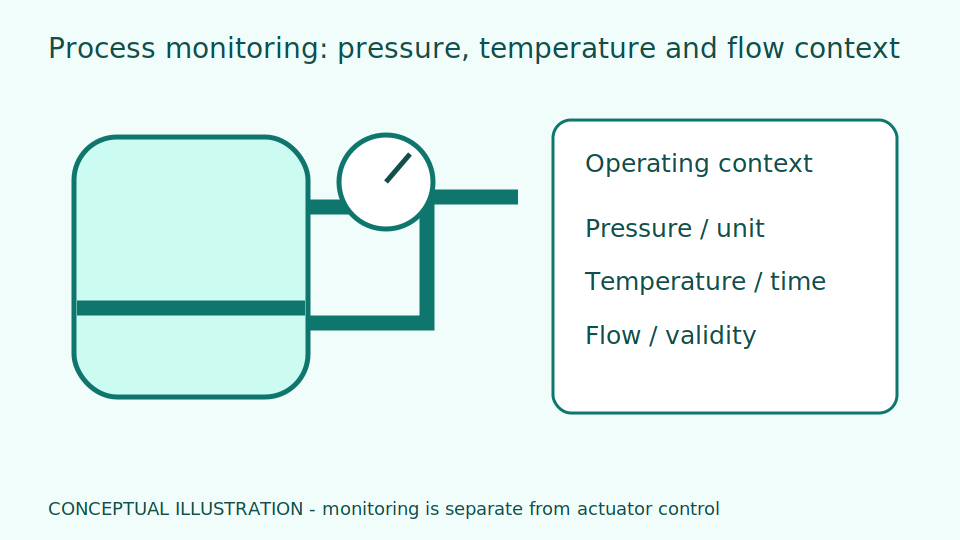
Assess area classifications, permitted equipment, access and safety constraints before camera placement.

Energy and utilities

Define reading identities, continuity and coexistence with existing systems without disturbing protection circuits.

Manufacturing and quality

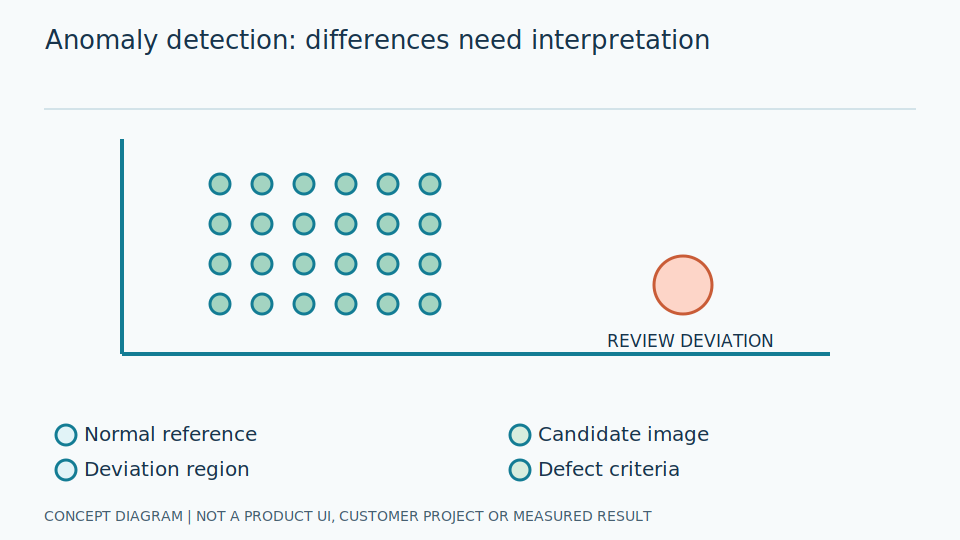
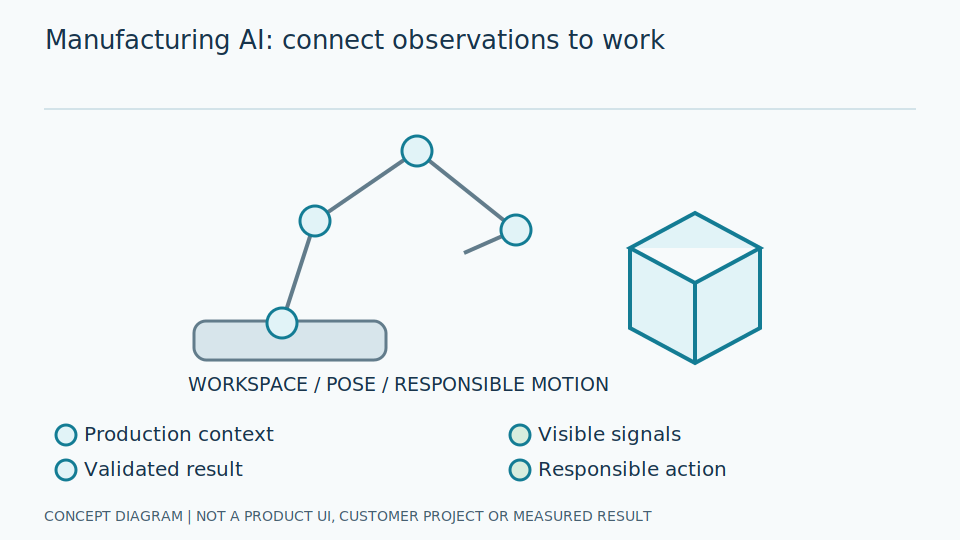
Use measurable baselines, test across shifts and distinguish reading errors from process problems.

Browse by project stage

Connect technical knowledge to a testable scope.

01

Reading pipeline

From capture to quality-checked observations.

Read More
02

Instruments and limits

Scales, displays and visibility conditions.

Read More
03

Data integration

Data contracts and destination testing.

Read More
04

Services and scope

Assessment, design, installation and handover.

Read More

Compare with evidence, not guarantees

Topic Current reading method Image-reading system to validate
Error Review actual reading and recording methods Compare reference values and report invalid rate
Time and labor Include travel and other inspection duties Include monitoring, review and maintenance
Unreadable cases Have an operator reread procedure Return invalid with a reason; never invent a value
Continuity Depends on rounds and recording Test cameras, networks, queues and stale states
Costs Measure actual baseline costs Include investment and lifetime running costs

From a visible image to usable information

Imagine an operator walking to a dial, writing down a number and entering it into a computer. This involves more than seeing a needle. A camera captures the image, Computer Vision locates and interprets its contents, and the data system associates the result with an instrument, time and unit. Design must cover that entire path, not just the AI model.

An image may contain numbers, symbols and conditions that affect the answer. A reflection can hide part of a needle; a dark indicator may reflect a power fault rather than the expected process state. Reading an observation is not the same as understanding its cause. Keep image evidence separate from process conclusions and leave decisions to the responsible person.

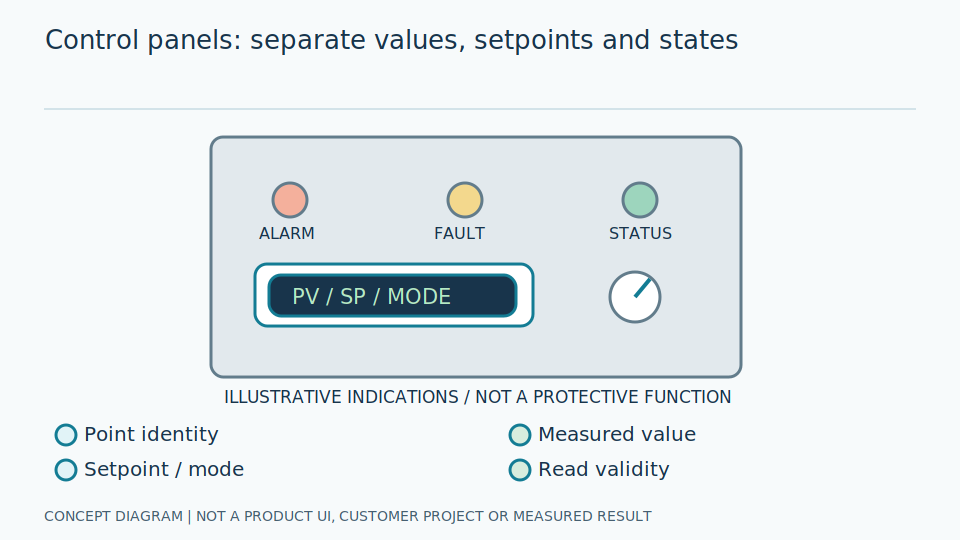
For engineers, begin by defining whether the output is a numerical value, state or event. Then specify its context: reading-point identity, capture time, validity and the reason an observation could not be read. These fields support traceability and prevent an old value from being mistaken for a current measurement.

Start with the problem, not the word AI

For transcription work, ask how many points are read, how often and what the data is used for. For inspection, define acceptance, rejection and the consequences of each kind of error. Representative examples of the existing work are more useful than choosing the longest list of technologies.

Some tasks can use simple image rules or existing sensor data without training a new model. Others need learning because appearance, lighting or surfaces vary. Compare alternatives with the existing method, including data preparation, camera maintenance and review effort. Greater complexity does not automatically produce greater value.

A trial can start at a low-risk point, observing alongside the existing method without controlling it. This is shadow mode. Include difficult lighting and operating conditions, not only easy examples, before agreeing on an appropriate deployment scope with an SI partner.

Use this website to prepare a project discussion

Equipment guides explain what an observation can establish, technology guides explain processing methods, and IoT guides explain data movement and management. Solutions and applications connect those subjects to practical decisions. You do not need to read every topic in order.

General readers can start with an example and follow unfamiliar terminology. Project teams should also read evaluation, limitations and checklists. Illustrative scenarios explain a method; they are not proof of a customer installation or a guarantee of identical results in every environment.

Prepare shareable images, the existing workflow, site constraints and the intended receiving system before contacting an SI partner. Do not send passwords or unnecessary personal information. This context helps separate work that can be designed immediately from questions requiring a survey, trial or confirmation of actual product capabilities.

Start with your site information

Prepare images, instrument types, point counts, reading frequency and destination systems to discuss pilot scope and acceptance.

GaugeSnap — read within defined limits, deliver quality-aware data and validate before scaling.

Explore AI Technology and Practical Guides

Read published articles on principles, limitations and system evaluation.

News