
Principles, Scenarios and Suitability
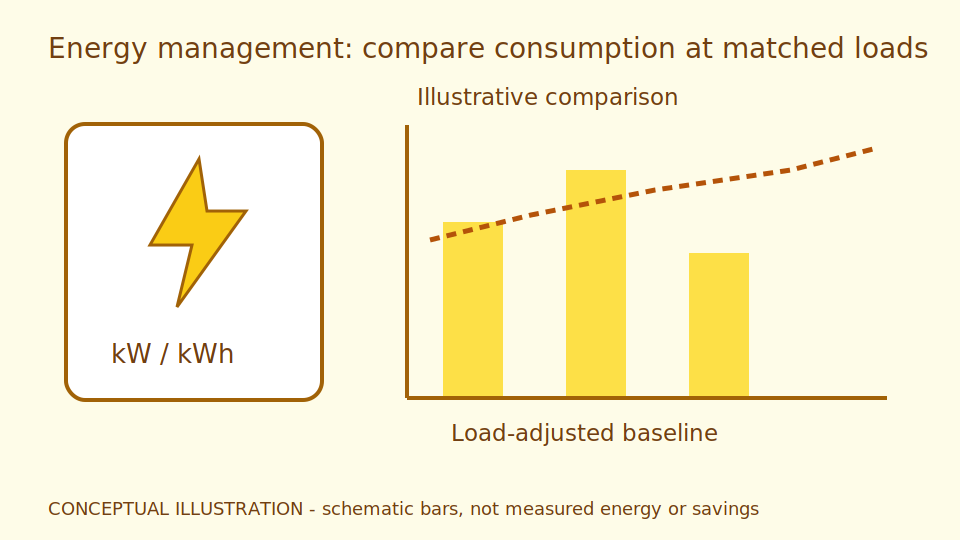
Energy management starts with metering boundaries and an energy balance, not electricity bills alone. Cumulative energy and instantaneous power are different quantities. Establish a baseline adjusted for production volume, operating hours and weather before deciding whether an intervention has worked.
Think of comparing cars that travel different distances: factory electricity totals are similarly not directly comparable when output differs. Kilowatts describe the rate of energy use; kilowatt-hours describe the amount accumulated over time. A baseline describes expected consumption under a particular workload. Record rejected output and rework too, because energy per acceptable unit can rise even if the machinery consumes the same electricity.
Separate the energy used even without production from consumption that increases with work. Submeters help locate demand but add calibration and clock-maintenance duties. Start with a boundary whose totals can be reconciled against the main meter. Production staff and energy engineers should explain unusual periods together. The useful outcome is comparable consumption periods and questions for site inspection, not a verdict that a department is inefficient.
Scroll the diagram horizontally to inspect all details.
Illustrative Design Scenario
Illustrative design scenario: compare compressor electricity use across shifts with similar loads, then investigate whether energy consumed during production stops is associated with leaks or unloaded running. The data helps technicians form hypotheses for inspection; a single chart does not establish the cause.
For illustration only, a shift consuming 600 kilowatt-hours to produce 300 acceptable units uses 2 per unit. Another consuming 500 to produce 200 uses 2.5 per unit. Total consumption falls while energy intensity rises. That does not establish that an intervention failed if products or waiting periods differ; compare shifts with similar conditions first.
Operators might choose between a leak survey during a planned stop and a revised compressor schedule. Either choice can affect pressure reserves and production readiness. Technicians should inspect air-use points and production staff should confirm demand before a trial. Record one change at a time and monitor energy and product quality together. Do not reduce pressure while ignoring equipment requirements.
Inputs and Prerequisites
Prepare a metering diagram, units, CT/PT multipliers, reading times, tariffs and production records, together with calibration status. Distinguish unreadable values from zero and identify periods when meters were replaced.
CT/PT devices transform current and voltage for measurement. An incorrect multiplier corrupts the entire total even when the chart looks smooth. Retain raw cumulative readings alongside converted values and identify the meter owner so that the conversion can be checked later.
Reporting output should state the interval, units, load boundary and proportion of complete readings. When a cumulative register decreases, investigate meter replacement or register rollover before calculating consumption. Do not create negative energy or silently fill missing intervals with zero; both would distort the baseline and subsequent comparison.
Trial and Integration Workflow
- 1Define the load boundary and check that main and submeter readings are not counted twice.
- 2Align timestamps, calculate energy per interval and build a baseline from representative reference periods.
- 3Trial one intervention at a time and compare against a baseline adjusted for operating load.
Evaluation and Acceptance Criteria
Check reading-interval completeness and differences between totals and a reference meter. Define how holidays and changes in production capacity will be handled before the trial. Report savings with uncertainty; a before-and-after difference is not automatically evidence that the intervention caused it.
Reserve periods not used to build the baseline for checking it. Look for larger prediction errors on hot days or after product changes. A difference smaller than the measurement uncertainty is not yet clear evidence of savings, regardless of how convincing a chart appears.
A reviewer should be able to trace a monthly total back to sample meter readings and production records. Narrow the conclusion if substantial data is missing. Report the number of excluded intervals and their reasons rather than selecting only days with favourable results.
Scroll the diagram horizontally to inspect all details.
Failure Cases and Limitations
Changes in product mix and production schedules may look like energy savings. Image readings add uncertainty from scales and lighting. Carbon calculations require emission factors with a stated source, year and boundary; the system does not independently certify those factors.
More detailed metering does not identify mechanical causes by itself. Unloaded operation may be needed for warming equipment or maintaining reserves. Ask operators about its purpose before classifying it as waste, and distinguish avoidable consumption from a legitimate operating requirement.
Load-reduction proposals must also consider comfort, product quality and safety constraints. This monitoring is not an electrical protection circuit. Educational carbon calculations are not certification of a site's emissions report, and an apparent saving must not justify bypassing the site's approved operating requirements.
Practical Checklist
- Are power and energy units kept distinct?
- Does the baseline account for production load and shutdowns?
- Has the responsible person confirmed the emission-factor source?