
Content Level: Overview / Implementation considerations
Principles and Suitability
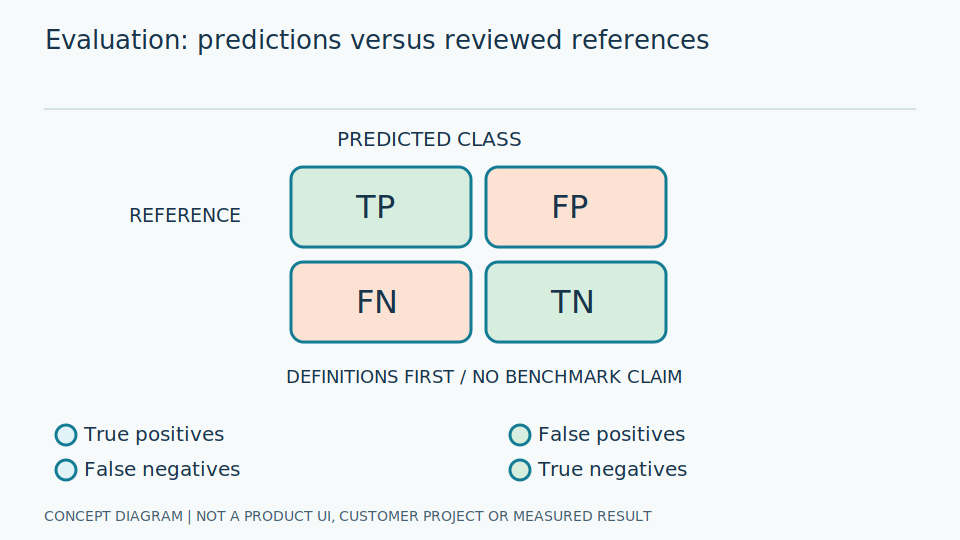
Precision = TP/(TP+FP) describes the reliability of positive predictions; recall = TP/(TP+FN) describes how many targets are found. F1 is their harmonic mean. Intersection over Union (IoU) is intersection area divided by union area, while mAP summarizes precision-recall curves under stated matching criteria.
Precision asks what fraction of reported detections is correct; recall asks what fraction of real targets is found. TP means a correct detection, FP a false detection and FN a missed target. Start metric selection with the user's decision: reporting a nonexistent gauge and missing a real one create different burdens, even when some combined scores happen to match.
Define matching before counting, including required box overlap and one-to-one assignment. AP summarises the precision-recall relationship across score thresholds; mAP averages according to declared groups or conditions. State the averaging and matching rules. Numbers obtained under different rules are not interchangeable measurements, and a shared metric name does not make their evaluation procedures equivalent.
Scroll the diagram horizontally to inspect all details.
Illustrative Industrial Example
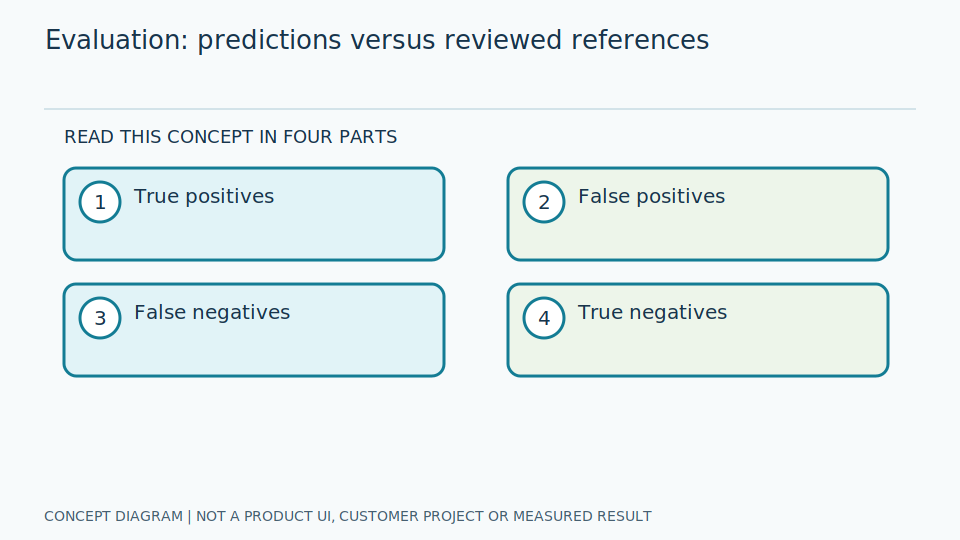
Hypothetical calculation: eight correct gauge boxes, two incorrect boxes and two missed gauges produce precision and recall of 0.8. These figures still do not show whether the pressure readings are correct. They are a calculation example, not product performance results.
There are ten real targets and ten proposed boxes. Precision's denominator counts proposals; recall's counts real targets. Equal numerical values therefore do not have identical meanings. If a lower threshold adds boxes, count whether the additions are correct or false. More detections do not establish better overall quality without considering the workload from incorrect boxes.
In another hypothetical calculation, two reading errors of one and three units give an MAE of two units, provided units match. An unreadable image has no numerical error to average, but remains a system outcome that needs separate reporting. Keep counts of initial images, detected boxes, successful readings and readings within tolerance. These reveal where the pipeline loses useful outputs instead of hiding losses behind a final average.
Study and Trial Workflow
- 1 Define the test unit as a box, image or gauge and specify the matching procedure before measurement.
- 2 Select confidence and IoU thresholds using validation data.
- 3 Report detector metrics separately from reading MAE in physical units, within-tolerance proportion and no-read rate.
Evaluation and Metric Definitions
State denominators, sample counts and results by subgroup. If there are no positive predictions or no targets, identify metrics that cannot be calculated instead of replacing undefined results with perfect scores.
Show counts alongside proportions so readers know the amount of supporting data. Small gauge groups should not disappear inside an overall average. Break results down by type, size and lighting, with error images explaining their meaning. Reporting rejections prevents stricter thresholds from appearing beneficial solely because difficult inputs have stopped contributing numerical errors while still needing human inspection.
Check counting code against small hand-calculated cases, including duplicate boxes, absent targets and groups with no proposals. Fix development thresholds before testing independently; do not adjust them to reach a desired test score. Record answer versions and postprocessing, because matching-rule or box-filter changes can alter metrics without changing the model. Evaluation software and its conventions are part of the experiment.
Limitations and Failure Cases
High mAP does not guarantee correct decimal readings. An overall average may conceal missed gauges of a rare type, so task-level and subgroup results remain necessary for interpreting the detector score.
Every summary hides information: F1 does not separate the costs of false and missed boxes, and MAE can conceal very large individual errors. Optimising one score may encourage winning the metric instead of resolving users' problems. Inspect error distributions and consequential cases, rather than substituting rankings for explanation of the task's limitations and the kinds of errors people must handle.
Tolerance should follow operational context and reference uncertainty, not be chosen from what the model already achieves and then declared sufficient. Following a documented evaluation method is not product certification. When data misses operating conditions, state the scope honestly instead of extending bounded test results into a claim of general accuracy in every situation. The reference rules support interpretation, not unsupported promises.
Practical Checklist
- Are true positives and reading tolerances clearly defined?
- Does the report include images that could not be read?
- Are detection results separated from numeric-reading results?